This week is Modes Less Traveled - Bicycling and Walking to Work in the United States: 2008-2012 from the ACS.
The commute.csv dataset on Github was tidied from 6 raw excel files. The code and final dataset was already provided.
Code for tidying summary tables by demographics was also provided.
First, look at data using head:
## # A tibble: 6 x 9
##   city       state    city_size mode      n percent   moe state_abb state_region
##   <chr>      <chr>    <chr>     <chr> <dbl>   <dbl> <dbl> <chr>     <chr>
## 1 Aberdeen … South D… Small     Bike    110     0.8   0.5 SD        North Centr…
## 2 Acworth c… Georgia  Small     Bike      0     0     0.4 GA        South
## 3 Addison v… Illinois Small     Bike     43     0.2   0.3 IL        North Centr…
## 4 Adelanto … Califor… Small     Bike      0     0     0.5 CA        West
## 5 Adrian ci… Michigan Small     Bike    121     1.5   1   MI        North Centr…
## 6 Agawam To… Massach… Small     Bike      0     0     0.2 MA        Northeast
Still some small things to tidy:
- fix those with missing state abbreviation or region
- re-check to see the errors are all fixed
## # A tibble: 4 x 9
##   city        state   city_size mode      n percent   moe state_abb state_region
##   <chr>       <chr>   <chr>     <chr> <dbl>   <dbl> <dbl> <chr>     <chr>
## 1 El Paso de… Ca      Small     Bike     71     0.5   0.4 <NA>      <NA>
## 2 West Sprin… Massac… Small     Bike     23     0.2   0.2 <NA>      <NA>
## 3 Washington… Distri… Large     Bike   9347     3.1   0.2 <NA>      <NA>
## 4 Washington… Distri… Large     Walk  37055    12.1   0.5 <NA>      <NA>
## # A tibble: 2 x 9
## city state city_size mode n percent moe state_abb state_region
## <chr> <chr> <chr> <chr> <dbl> <dbl> <dbl> <chr> <chr>
## 1 El Paso de … Ca Small Bike 71 0.5 0.4 CA West
## 2 West Spring… Massa… Small Bike 23 0.2 0.2 MA Northeast## # A tibble: 0 x 9
## # … with 9 variables: city <chr>, state <chr>, city_size <chr>, mode <chr>,
## # n <dbl>, percent <dbl>, moe <dbl>, state_abb <chr>, state_region <chr>Next, I clean the added words “village”, “town”, “city”, etc from the end of each city name, create a concatenation of city and state, and geocode using google maps. I saved this as a CSV to save time when re-running the file. The code is commented out, but shown for completeness.
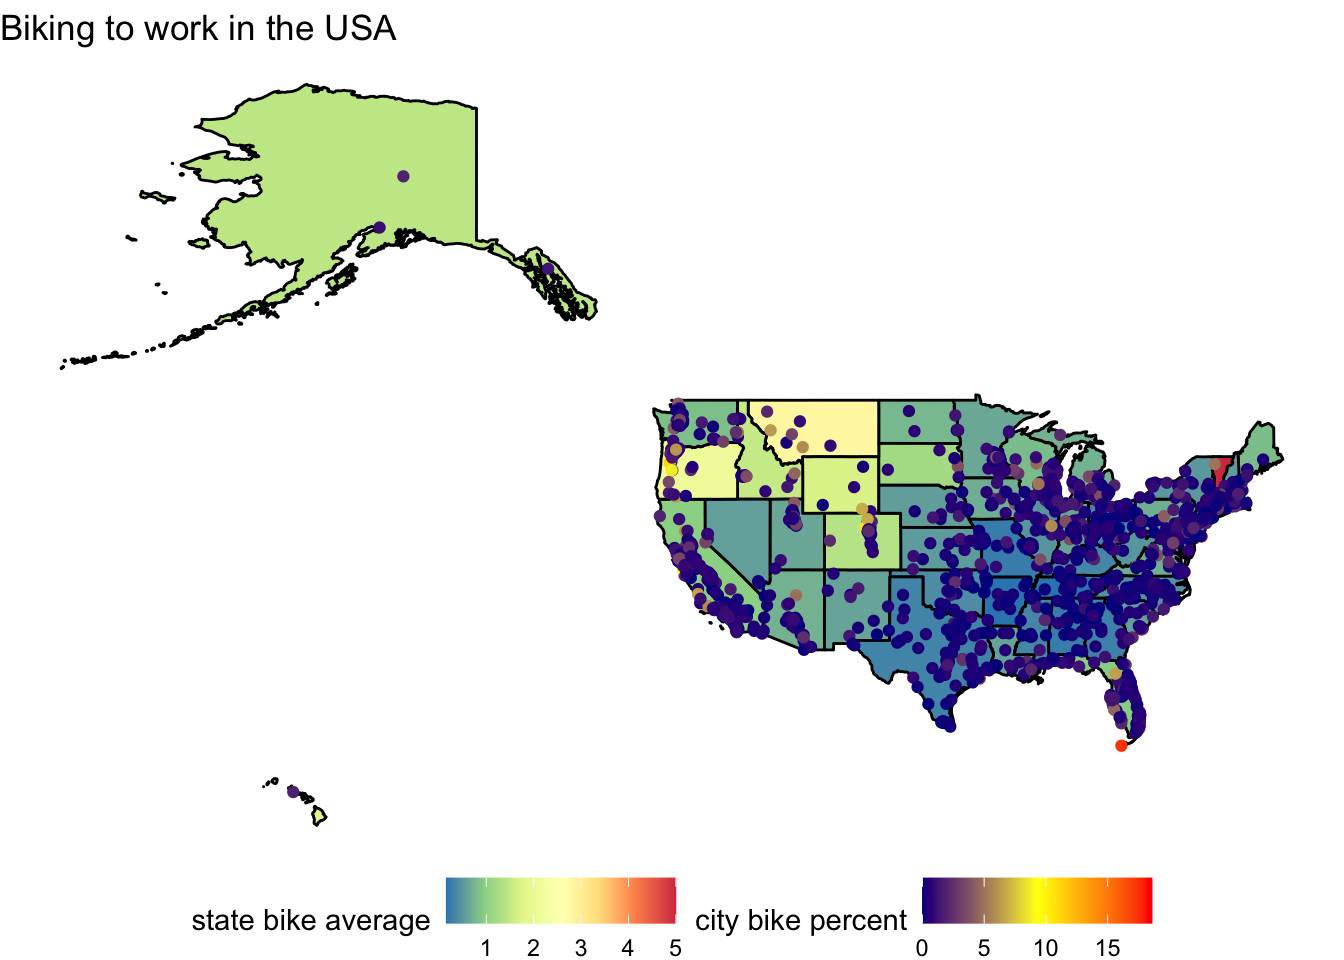
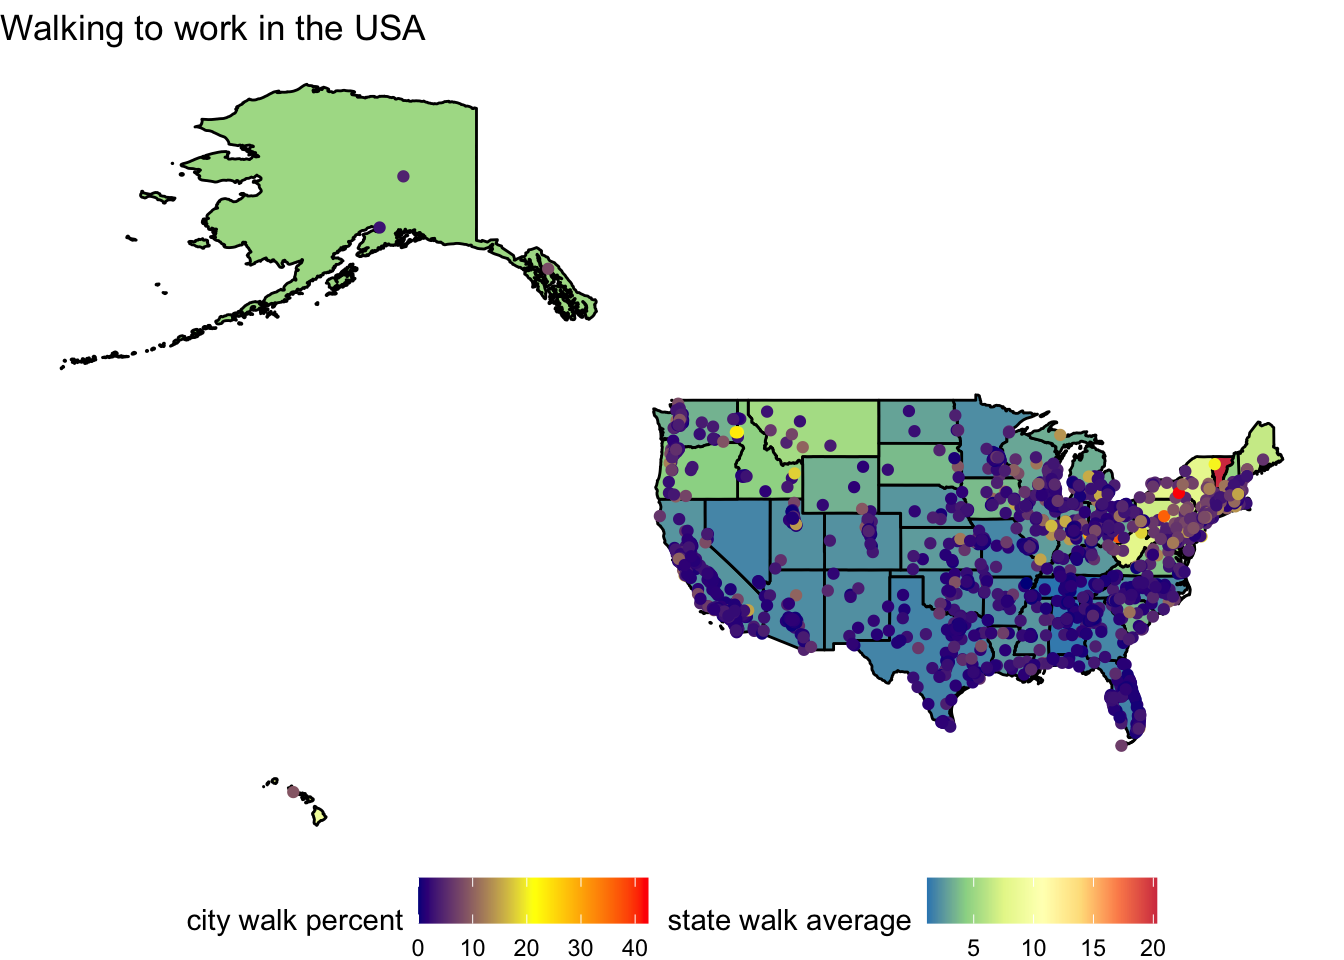
I used choroplethrMaps to get the USA state-level data, which I joined to state averages of walk and bike travel.
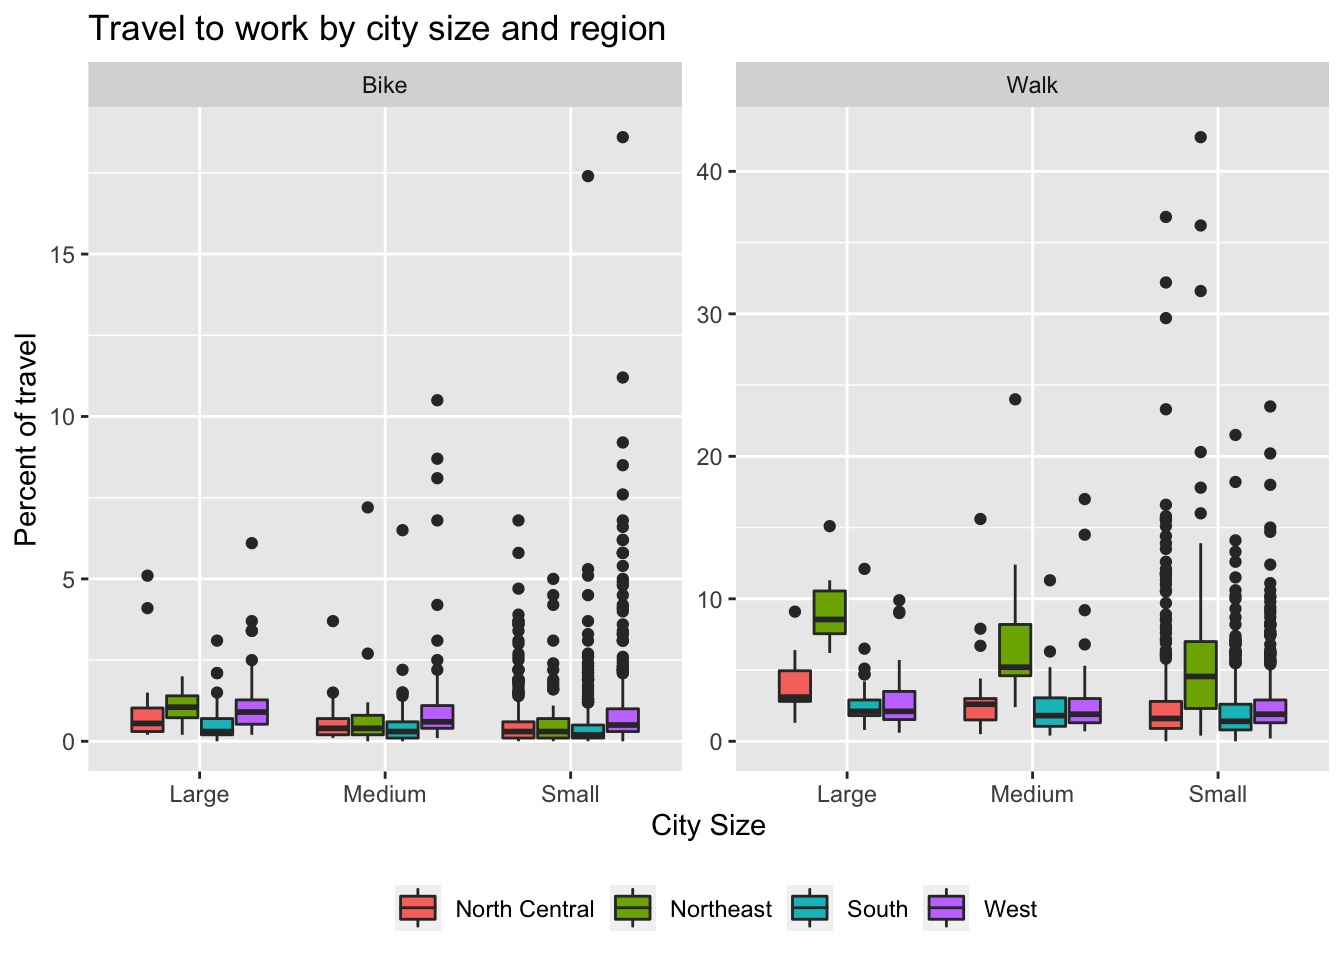
Below are box plots of mode of travel by city size and region. There are more walkers, more variation in small cities, and it looks like the northeast may have more walkers than other regions.
Finally, I map the data below. Each point represents a city in the dataset. The points and states are colored according to the percent of mode of travel, by city or averaged over the whole state. I also piped to plotly so the maps are interactive.