State Tweets
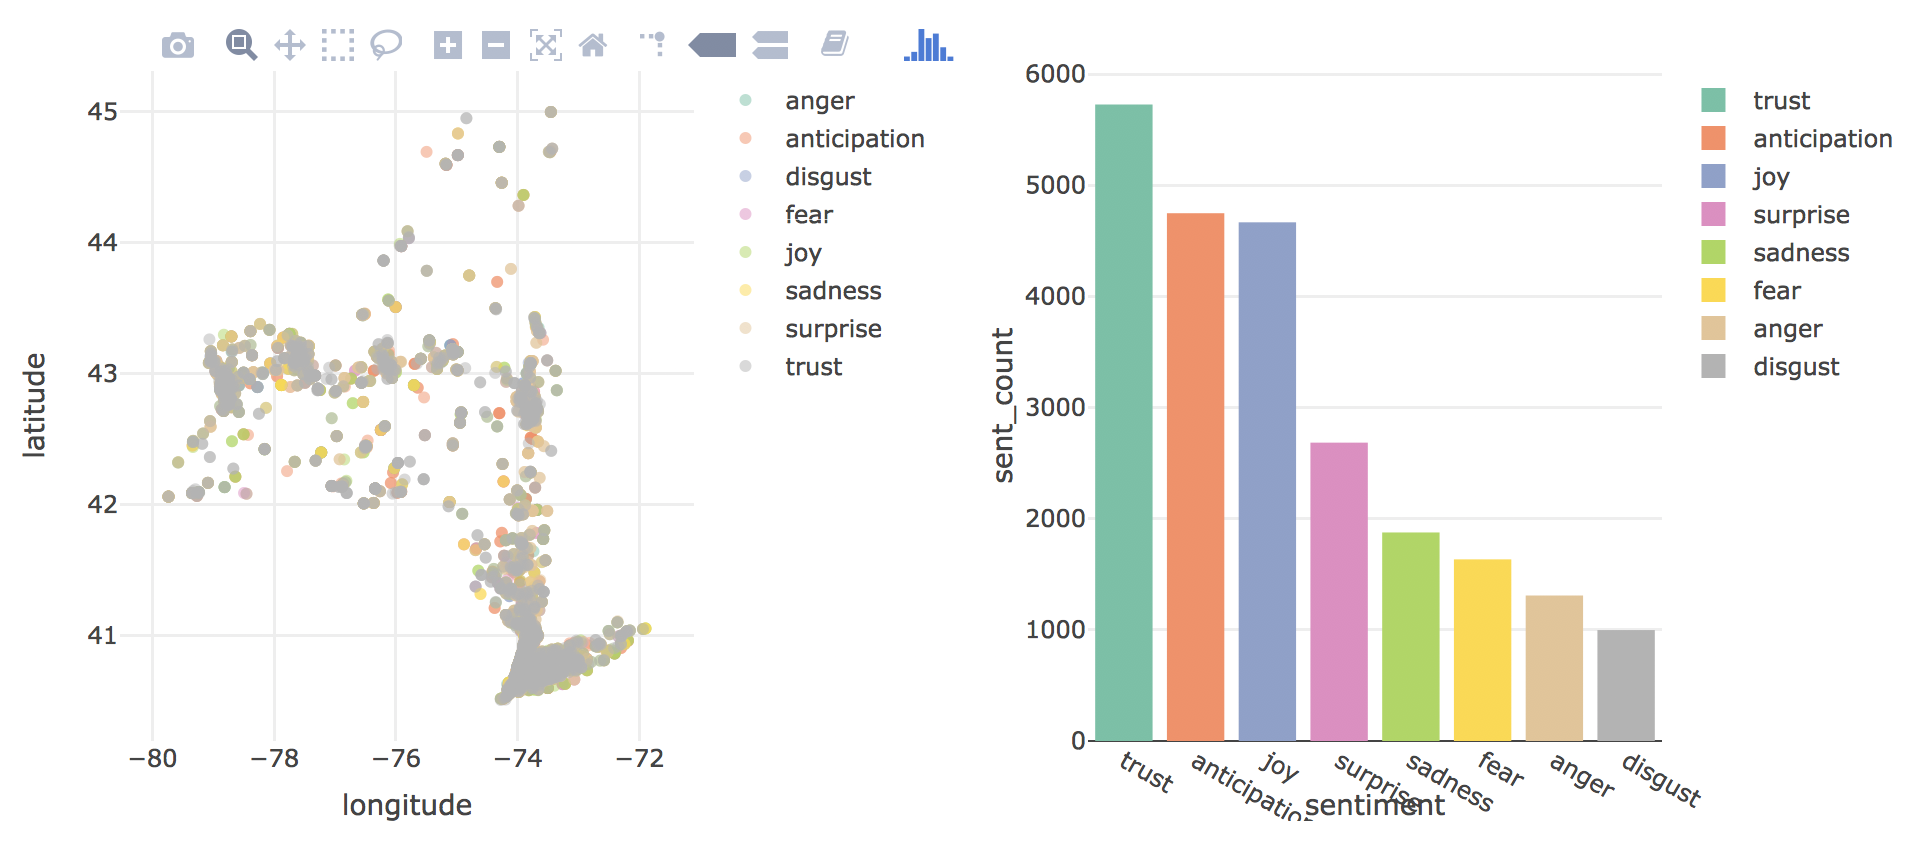
The map below shows the distribution of sentiments across the state of New York. Alongside is a bar chart displaying the count of sentiment in the state.
Check it out!
We could also look at another state and compare how the sentiments differ across state/location at once! The shiny app below allows for the selection of two states for a comparison.
Click here for the shiny app to explore!